
Recently, I have completed development of a variety of models to estimate individual performance and the effects of external factors on NHL game outcomes. Using these performance estimates, I can construct a Monte Carlo simulation engine using the general league shot-taking and penalty-taking environments to obtain an improved conceptualization of how the interaction of qualities the models attempt to isolate may affect the outcomes of NHL games beyond what we reasonably have access to in observed data, with the primary intent to predict and anticipate the results of future NHL games.
An expanded explanation of the models used to determine the ability of individuals (skaters, goaltenders, and coaches) involved in a game, along with the influence game contexts provide,, is provided here. The specific performance estimates that are implemented into the simulation engine for each position include:
-
EV and PP Corsi For
-
EV and PK Corsi Against
-
EV and PP Fenwick For (Shot Map)
-
EV and PK Fenwick Against (Shot Map)
-
Penalties Drawn/Taken
-
Goals (Finishing)
-
Primary Assists (Induction)
-
Secondary Assists (Induction)
-
EV and PP Corsi For
-
EV and PK Corsi Against
-
EV and PP Fenwick For (Shot Map)
-
EV and PK Fenwick Against (Shot Map)
-
Penalties Drawn/Taken
-
Goals Against (Goaltending)
Before simulating a game, the engine stores and maintains certain properties. Most importantly, this includes the team components. Each of the skater performance estimates is expanded by their per-hour values (either the total or across the shot map) to raw totals based on projected time-on-ice in a 60-minute game, using their observed time-on-ice per game, and then is summed together for the team’s skater impact. Coach impacts are computed similarly, using the entire game, or 60 minutes, as the factor to expand the estimates by. Combining these two and dividing by 3600 yields the per-second team component, either in total or per (x, y) coordinate.
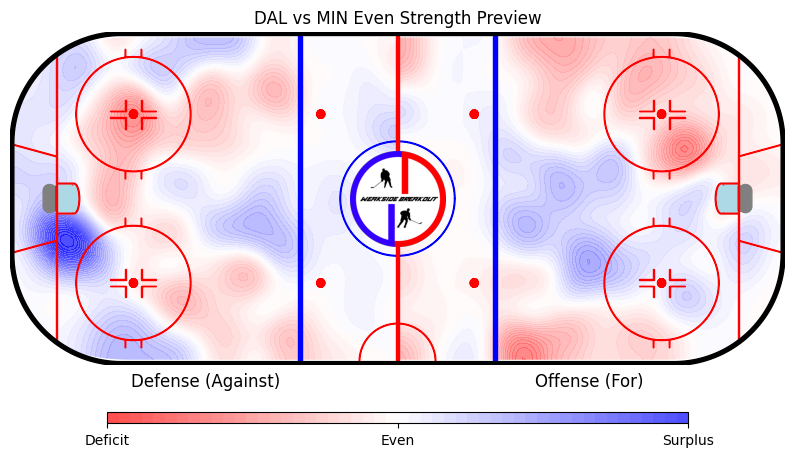
After obtaining the components for each team, they are averaged against each other so that each team has a change (from league-average) in probability of recording that particular event in a given second, considering not only their team strength in terms of recording the event but also the opposing team’s strength in terms of preventing the event from occurring. Using the league constant for that event, the finalized probability of a certain event occurring for a team is calculated. Team components for shot attempts for on the penalty kill use league-average rates only, since estimates for these are not obtained at this time. A visualization of the Fenwick components is provided below:
[
](https://substackcdn.com/image/fetch/$s_!bXui!,f_auto,q_auto:good,fl_progressive:steep/https%3A%2F%2Fsubstack-post-media.s3.amazonaws.com%2Fpublic%2Fimages%2Fb93585ae-30a8-4f5d-8c71-6facbe389f01_795x457.png)
Dallas offense against Minnesota defense is on the right, while Minnesota offense against Dallas defense is on the left. This heatmap was generated as a preview of the 2025-2026 first-round matchup between these two teams.
In addition to the team components, each of the skaters involved in the simulation maintains observed rates and percentages used in the simulation engine. These include:
-
Rates of recording corsi shot attempts and assisting on Fenwick shot attempts
-
Rates of taking and drawing penalties
-
Rates of blocking shots
-
Percentage of Corsi shots going unblocked
-
Percentage of Fenwick shots reaching the goal
Other properties related to the general league environment used in the simulation engine largely include the contextual terms from the regression models (from either the current or immediately prior season of NHL play) used for the performance estimates, which are set to update the base team components for each second of play based on the current strength state. For example, shot rates of home teams and teams trailing in a game are elevated by the sim engine. The intercepts for each model are used as the constant for determining how frequently their respective events will occur.
Some sequencing terms are incorporated into the simulation engine. No shot can occur within the first five seconds of a game, while a team that has conceded a shot against cannot record a shot of their own for at least five seconds afterward. The power-play and penalty-kill expiry effects on even-strength shot rates are applied for only 10 seconds after penalties.
Lastly, empty net behaviors are simulated. A separate constant and shot map is maintained by the simulation engine for teams shooting on an empty net, used in place of that team’s Corsi component. An empty net curve, possessing the probabilities of a team pulling their goalie by how many goals they trail and how much time has passed (in seconds), is utilized to determine when the goalie is pulled. Goals against for the team with the empty net will place the goaltender back in for a brief amount of time (5 seconds) before reconsidering pulling their goaltender based on the curve.
With the performance estimates and simulation properties, the simulation engine is now ready. For each second in the game, the game state affects are updated and applied. Afterward, the following chain is used for each second:
-
Using the penalty rates for each team, randomly decide if a penalty occurs in that second. If one does, then select a random skater on the penalty-taking to join the penalty-box (based on observed penalty-taking rates) and a random skater on the penalty-drawing to draw the penalty (based on observed penalty-drawing rates).
-
Using the Corsi shot rates for each team, randomly decide if a Corsi shot occurs in that second. If one does, then use the observed Corsi-to-Fenwick percentages to randomly determine if the shot goes unblocked. If not, then select a shot-blocker. Otherwise, mark it as a Fenwick shot.
-
If a shot is a Fenwick shot, use the Fenwick map components to randomly select a shot location, and use this (and all other applicable features) to determine the xG of the shot. Next, randomly select shot-assisting players (with a 20 percent chance of there being none). Once all the individuals are selected for the shot (using observed shot and pass rates), interaction effects can be applied. The per-shot impacts for the shooter and passer are added together, then averaged with the goaltender’s per-shot impact for the final underlying change in goal probability. The xG model assumes league-average shooting, passing, and goaltending, so this simulates the individual talent not ordinarily accounted for by the model that we should expect to reflect in the outcomes of NHL games. Use this goal probability to determine if a goal occurs randomly.
-
If a goal does not occur, use the Fenwick-to-shot-on-goal percentages to decide if the shot reaches the net randomly. If it is a goal, then progress the game on as normal after marking the event as a goal.
-
If no events occur, progress as normal.
-
Based on the events that occurred and the current state of the game, update the shot and penalty rates.
This process is simulated for the entire game, or 3600 seconds. If the score is tied, then a 300-second overtime is conducted. If the game remains tied, then a coin flip is used for the shootout. Playoff simulations continue with 1200-second periods until a goal is scored.
As for penalties, the NHL penalty rules are embedded in the simulation as observed in real matches (including expiry of the penalty on a goal). Currently, major penalties are not simulated, although I would like to include these in the next update of the sim engine.
While the simulation is far from exhaustive, it addresses the vital outputs of a hockey match (shots, penalties, and goals) with the minimally necessary rules to ensure that the sequences of events in a single game are what would logically occur in a real NHL game. Satisfying this strictly ensures that the objective of developing an engine that can generate independent trials that stand on their own as valid representations of NHL games is achieved.
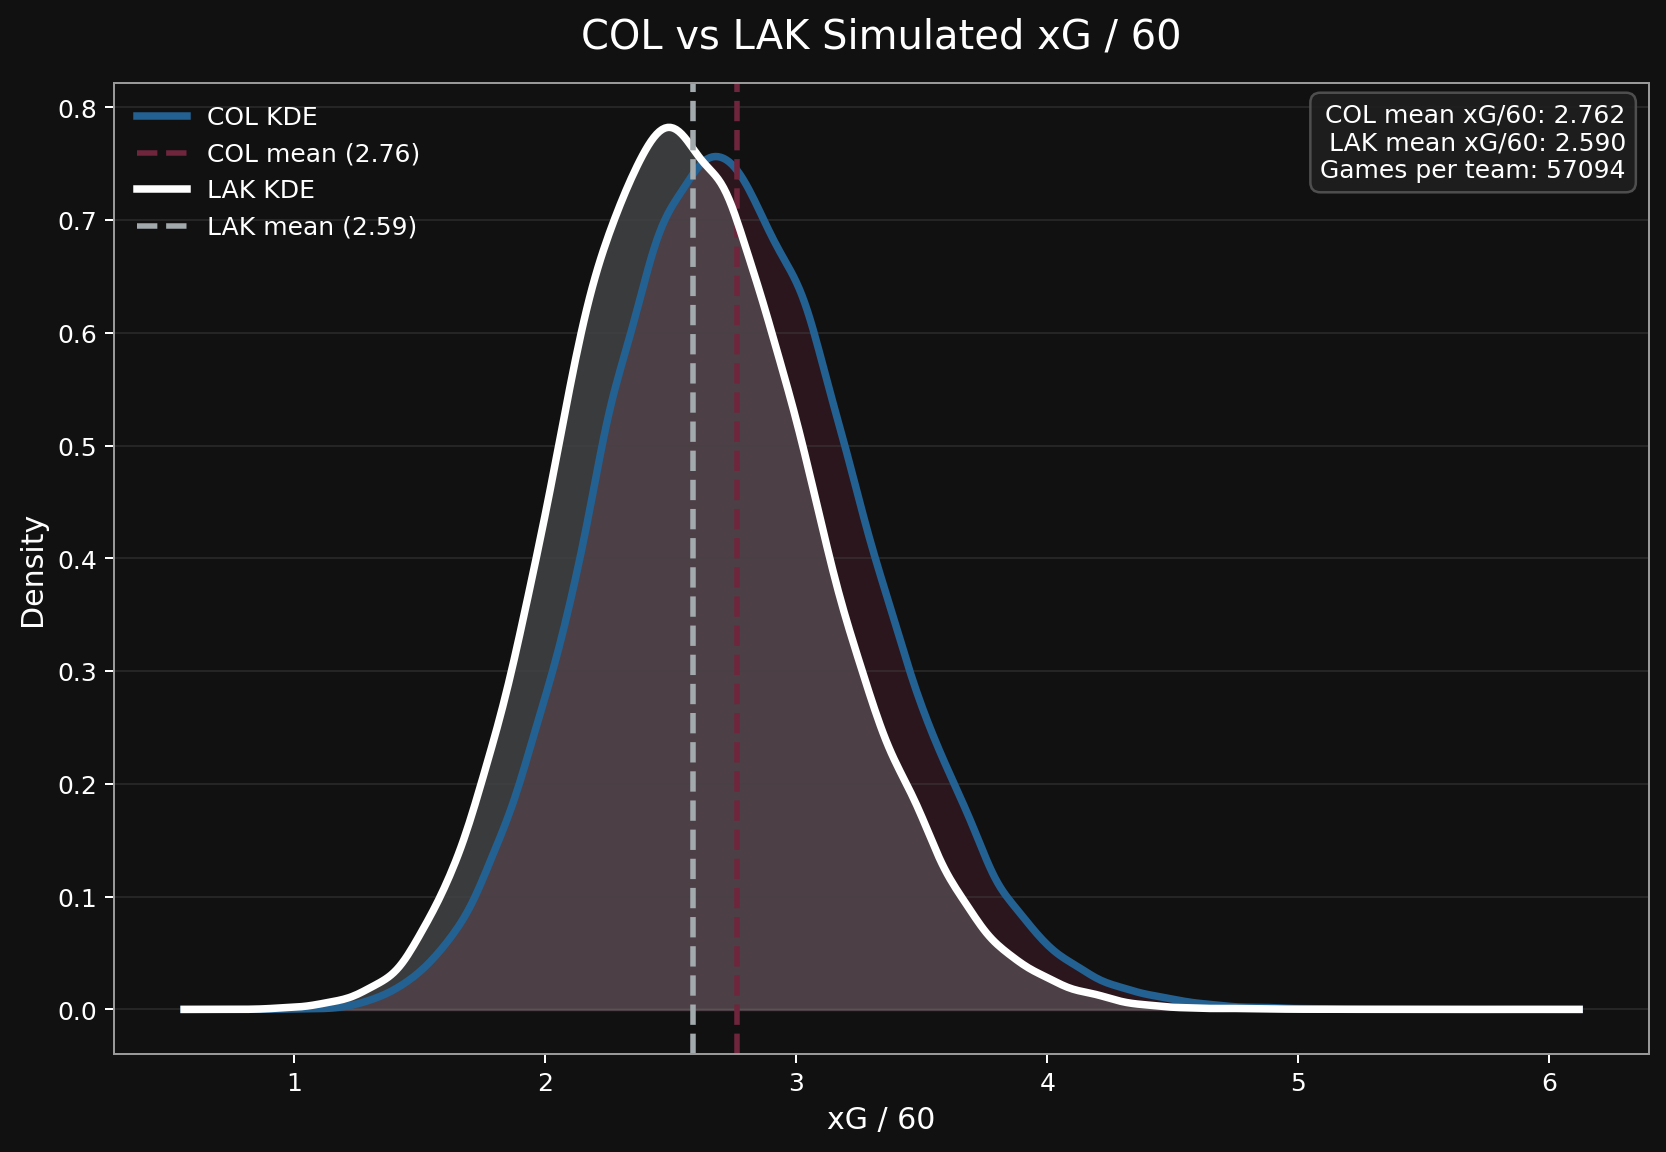
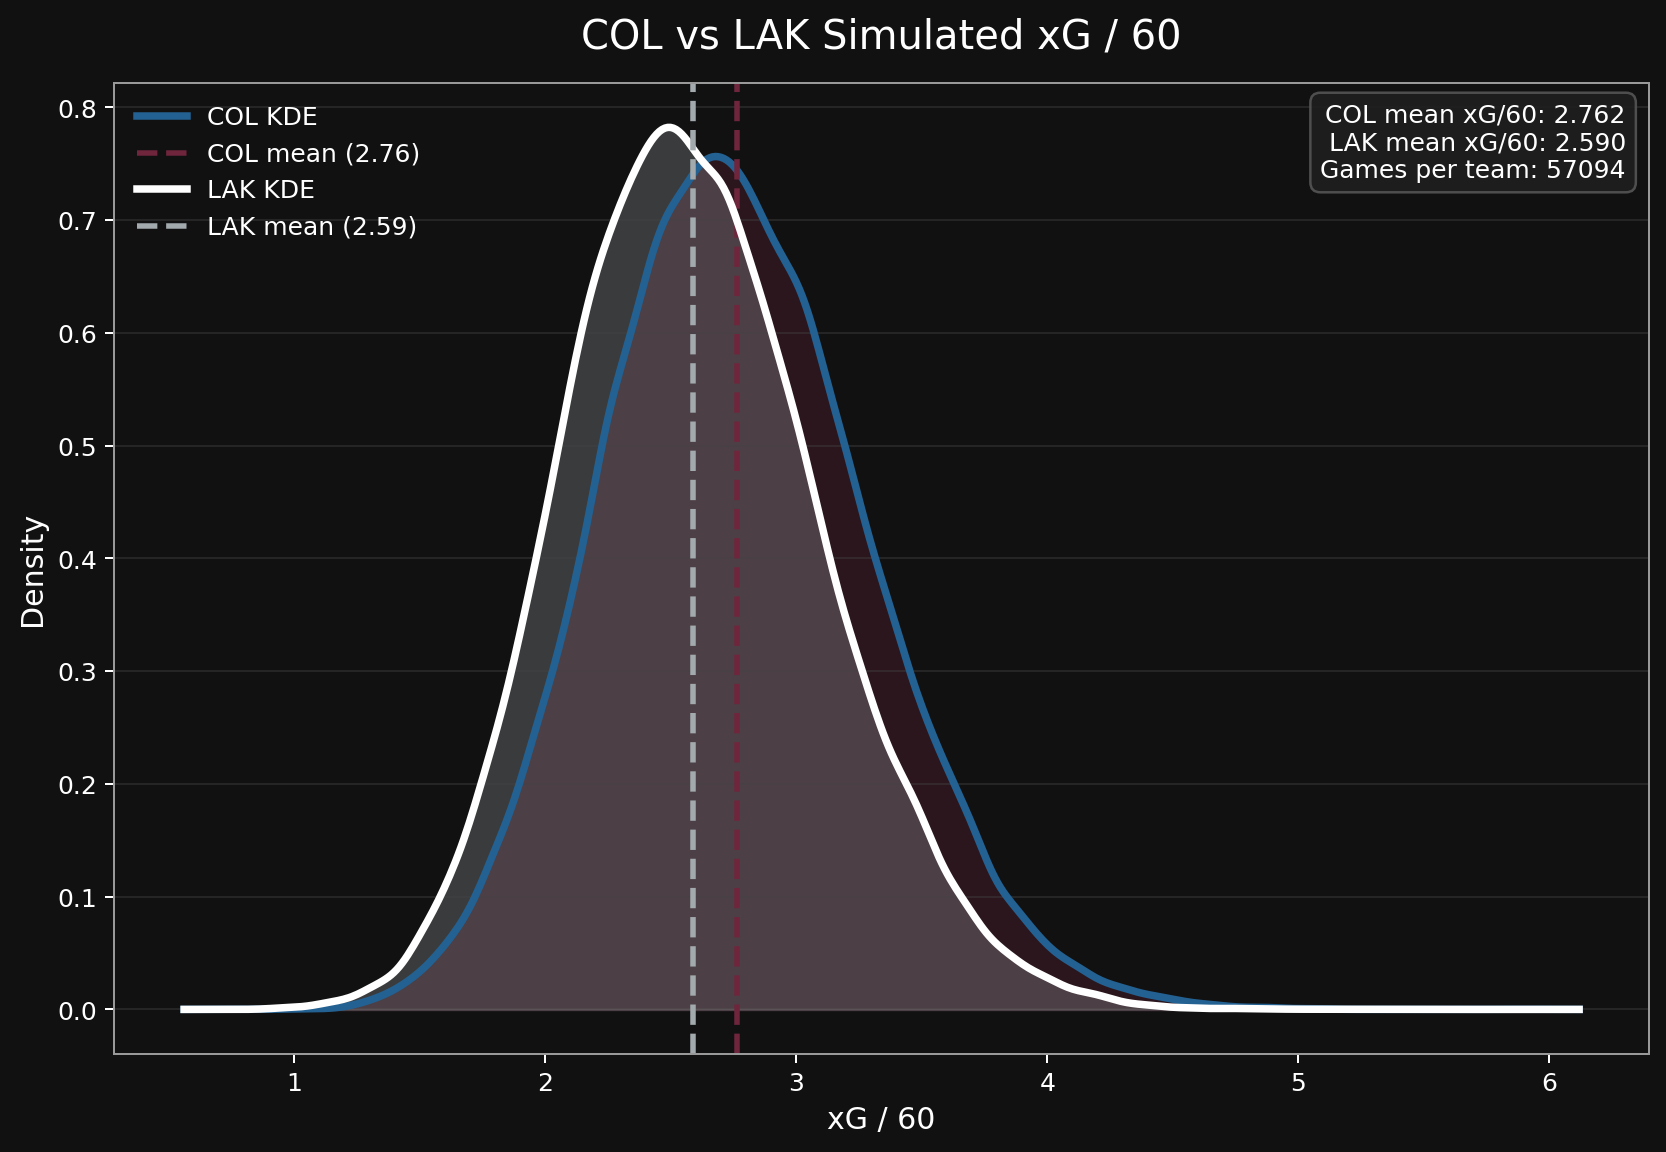
After simulating several thousand trials, the simulated distributions for the metrics tracked in the simulation engine are obtainable. For example, each team’s xG per sixty in a playoff series simulation:
[
](https://substackcdn.com/image/fetch/$s_!-3-Q!,f_auto,q_auto:good,fl_progressive:steep/https%3A%2F%2Fsubstack-post-media.s3.amazonaws.com%2Fpublic%2Fimages%2Fd1ce9818-1954-4982-9aeb-6e99e2360575_1666x1152.png)
Other events tracked by the NHL are not assessed with the simulation engine due to the significant imbalance in the complexity added and the model improvement associated with adding these events and their terms. However, some increased complexity could greatly benefit the engine. For instance, one major feature I am planning to add in the next iteration of this simulation engine is a separate shifts simulation engine, which will use observed shift behaviors from skaters and coaches built on top of a shift curve (denoting the probability of a single skater’s shift ending by shift length in seconds) to randomly select the on-ice skaters for each second in a game.